Mankind Pharma reports revenue growth of 19% YoY in Q4 FY23 and 12% YoY in FY23

New Delhi, India, June 01, 2023: Mankind Pharma (BSE: 543904 | NSE: MANKIND) India’s fourth1 largest pharmaceutical Company today announced its financial results for the fourth quarter and full year ended March 31, 2023. The information mentioned in this release is based on consolidated financial statements.
FY23 Performance Summary
- Revenue from Operations at INR 8,749 crore, up by 12% YoY
- EBITDA at INR 1,913 crore with margin of 21.9%
- PAT at INR 1,310 crore with margin of 15.0%
- EPS of INR 32.0 (FV Re.1)
- Cash flow from Operations of INR 1,813 crore
- CAPEX of INR 832 crore
- Net cash of INR 1,366 crore
Q4 FY23 Performance Summary
- Revenue from Operations at INR 2,053 crore, up by 19% YoY
- EBITDA at INR 419 crore, up by 45% YoY with margin of 20.4%
- PAT at INR 294 crore, up by 52% YoY with margin of 14.3%
- EPS of INR 7.1, up by 50% YoY (FV Re.1)
- CAPEX of INR 133 crore
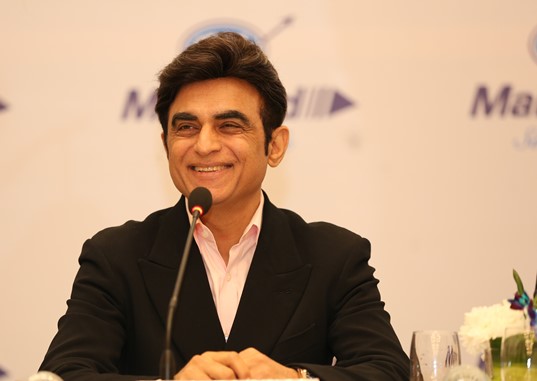
| Mr. Rajeev Juneja – Vice Chairman & Managing Director “The company maintained its strong growth trajectory during the year. Our domestic business continued to outperform the IPM in FY23, led by growth in chronic segments whose share has increased to 34% from 33% in FY22. Our consumer healthcare business has maintained its double-digit growth with dominant brand leadership in its categories. Our focus is on increasing value of prescription within existing class II-IV and rural markets and increasing penetration in Metros through higher chronic presence. We also plan to leverage our brand dominance to grow our consumer healthcare business, going ahead”. |
1 As per IQVIA, MAT March 2023
Operational Highlights
- Domestic Business
- Contributes c.97%* to revenue from operations in FY23
- Growth of 18%* YoY in Q4FY23 and 11%* YoY in FY23 as against IPM growth of 14.9% and 7.9% respectively
- Maintained market ranking of No. 4 with a market share of 4.4% in FY23 (6.5% market share in CVM)
- Volume growth of 2.6% against flat IPM growth in FY23
- Chronic segment contribution at 34% (33% in FY22) with 14% YoY growth – Q4 FY23 share at 35%
- Neptaz 2nd best New Introduction in IPM in FY23
- Total field force of c. 15,000*
Data as per IQVIA MAT March 2023; * denotes Internal data
Consumer Healthcare Business
- Growth of 10%* YoY in Q4 FY23 and 17%* YoY in FY23
- 4 consumer healthcare brands ranked #1 in their categories
- Focus on increasing rural penetration in key brands Manforce® Condoms and Prega News®
- Leveraging existing brand equity to launch brand extensions eg. Manforce® Epic, Prega News® Advance
- Expanding retail presence of key brands like Manforce®, Prega News® and Gas-o-Fast®
- Consistent investment in brand building
- Focussed print, TV and digital campaigns to enhance brand recall
Data as per IQVIA MAT March 2023; * denotes Internal data
- Exports
- Growth of 63% YoY in Q4 FY23 and 58% YoY in FY23
- Focus on differentiated filings
- New integrated API/formulation manufacturing plant expected to be commercialized in H1FY24
- Exploring export of Dydrogesterone to key export markets
Consolidated Profit & Loss Account
| In INR Crore | Q4 FY23 | Q4 FY22 | YoY% | FY 23 | FY22 | YoY% |
| Revenue from Operations | 2,053 | 1,726 | 19% | 8,749 | 7,782 | 12% |
| Gross Margin % | 67.2% | 67.6% | 66.7% | 68.9% | ||
| EBITDA | 419 | 290 | 45% | 1,913 | 2,004 | -5% |
| EBITDA Margin % | 20.4% | 16.8% | 21.9% | 25.8% | ||
| PAT | 294 | 193 | 52% | 1,310 | 1,453 | -10% |
| PAT Margin % | 14.3% | 11.2% | 15.0% | 18.7% |
Segmental Revenue Break Up
| In INR Crore | Q4 FY23 | Q4 FY22 | YoY% | FY 23 | FY22 | YoY% |
| Domestic | 1,972 | 1,677 | 18% | 8,453 | 7,595 | 11% |
| • Consumer Healthcare | 152 | 138 | 10% | 692 | 589 | 17% |
| Exports | 81 | 49 | 63% | 296 | 187 | 58% |
| Total | 2,053 | 1726 | 19% | 8,749 | 7,782 | 12% |
Balance Sheet
| In INR Crore | FY 23 | FY22 | YoY% |
| Net Worth | 7,435 | 6,155 | 21% |
| Net Cash | 1,366 | 412 | 231% |
| Inventory | 1,498 | 1,760 | -15% |
| Trade Receivables | 576 | 388 | 48% |
| Net Tangible Assets | 2,908 | 2,328 | 25% |

